Pharmaceutical blockbusters: the past, present, and future(?)
One of the uncomfortable truths about the pharmaceutical industry is that most approved drugs (~55%) don’t make enough money to recoup their development costs1. The distribution of drug profits is “fat-tailed”, and the profits from a small fraction of drugs subsidize the rest of the industry (with money to spare). Consider perennial top-seller Humira, which had revenues of $21 billion dollars in 2022 - roughly 14 times more than the median drug sells over its entire market lifespan.
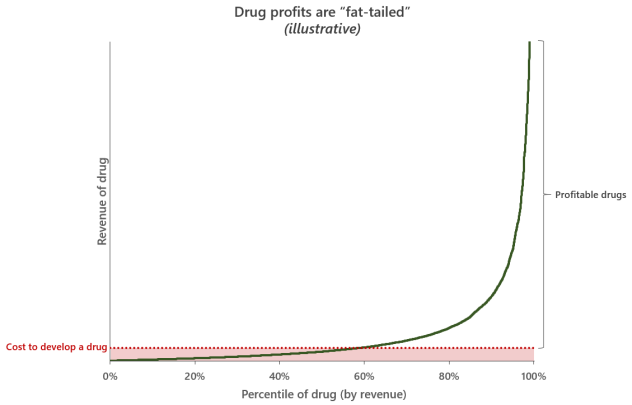
This extreme unevenness of potential returns means that pharmaceuticals is fundamentally a hits-driven business. Because drug development is so costly and most launches are duds, the industry as a whole relies on blockbusters - drugs with annual global revenues of $1 billion or more - to cover the flops and keep the entire enterprise afloat2. Making things harder still, the periodic genericization of drugs means the industry is in constant competition with itself and needs to produce a steady stream of blockbusters to replace lost revenues.
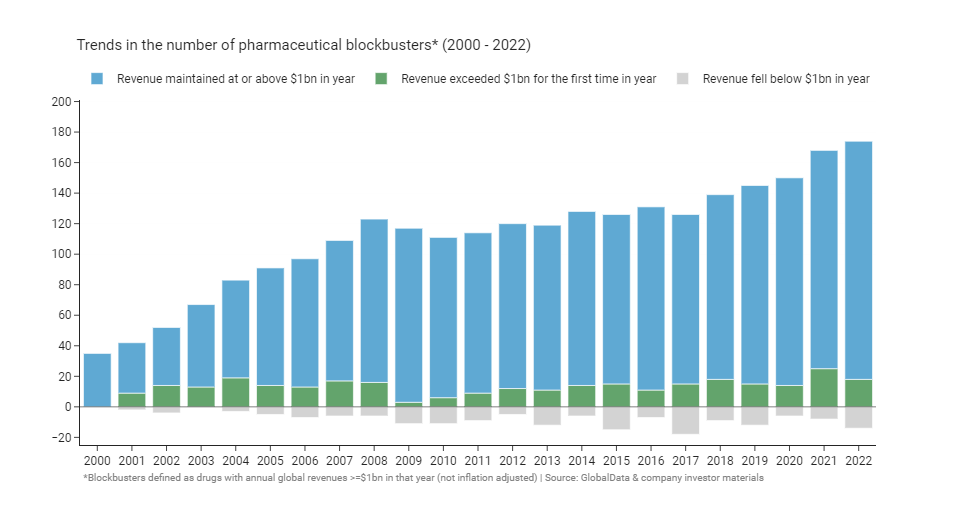
Despite the challenges, there are more blockbusters now than ever before3. From 2000 to 2022, the number of blockbuster drugs increased fivefold, going from 35 to over 1704. After 8 years of steady growth from 2000 onwards, the number plateaued at ~110 in the decade after the financial crisis, before resuming a slow growth again in 2018. That slow resumption of growth was subsequently accelerated dramatically by massive demand for COVID vaccines and therapeutics during the pandemic. Since 2000, an average of ~14 drugs have become blockbusters for the first time each year5, and ~8 have lost their status, falling back below $1 billion in annual revenues as they go generic, get leapfrogged by a competitor, or lose pricing power.
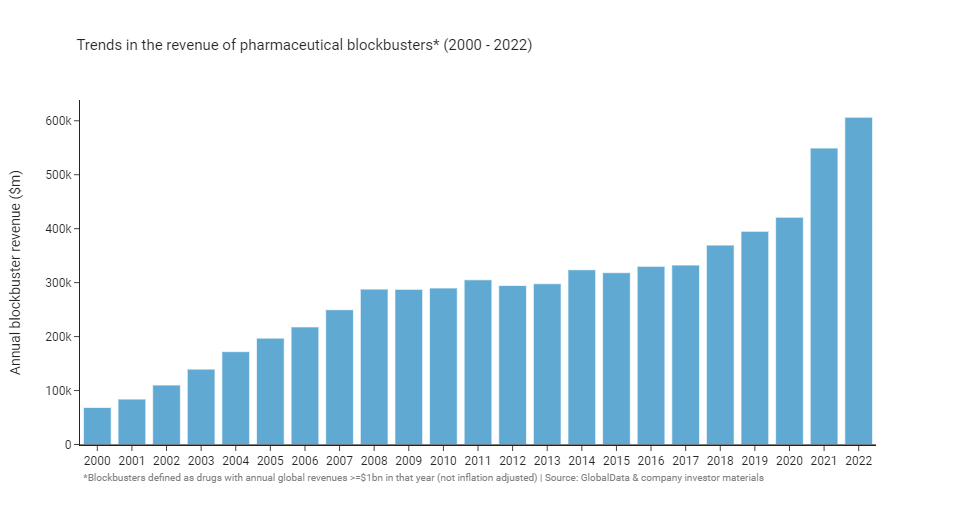
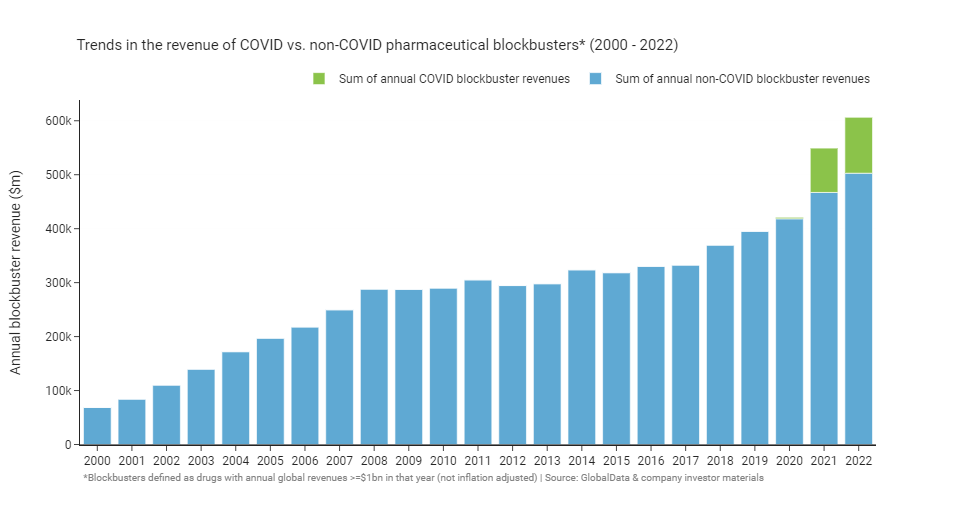
If we look at the summed annual revenue of blockbusters we see a similar overall shape: growth up to 2008, followed by a 10-year plateau, and growth again from 2018. The burst of revenue following COVID is particularly dramatic, coming in at $100-200 billion in additional annual revenue for blockbusters when compared to 2020.
According to IQVIA6, the global medicines market grew from ~$1 trillion annually in 2013 to ~$1.5 trillion in 2022. As a group, blockbusters account for 30-40% of that total medicines spend despite only representing a small fraction of approved medicines. Blockbusters are even more dominant as a portion of big pharma portfolios: although only 21% of drugs launched between 2011 and 2020 by the 20 largest pharmaceutical firms achieved blockbuster status, blockbusters accounted for ~70% of the revenues of these companies1.
Those were just the surface level numbers; looking deeper into the underlying trends reveals a great deal of change and turbulence that has taken place in the industry over the past two decades. Next I’ll break down those trends, as well as what they tell us about the history of the industry and where it may be going in the future.
Most blockbusters are copycats, not pioneers
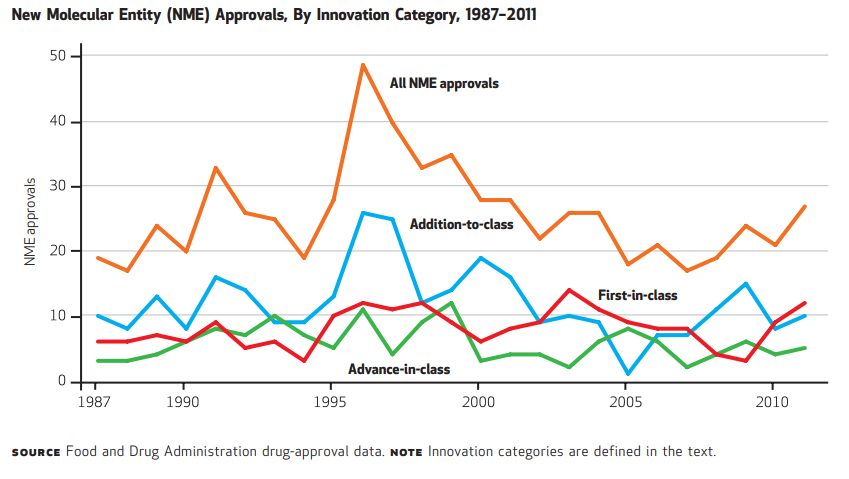
The FDA defines first-in-class drugs as “drugs with a new and unique mechanism for treating a medical condition”. Because they act differently to existing treatments, first-in-class drugs have the potential to offer step change improvements in efficacy, safety, convenience, or other factors that make a meaningful difference to patients’ lives. Pharmaceutical companies compete to bring differentiated products to market, and pursuing first-in-class drugs is a favoured means to achieve true differentiation. Using the FDA’s definitions78, we see that the proportion of blockbusters that are first-in-class has been consistent at around 30% over the years.
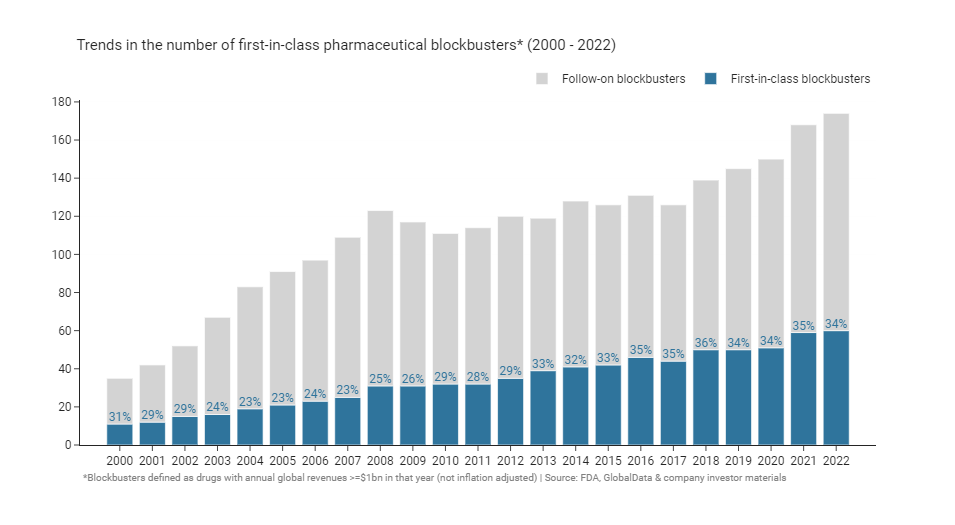
This percentage is consistent with the historical proportion of first-in-class approvals: 32% of drugs approved between 1987 and 2011 were considered first-in-class by the FDA8. While first-in-class approvals have been steady for long time, there has been an acceleration in the past few years. Since 2019, 40-50% of newly approved drugs have been considered first-in-class by the FDA8, in 2021 and 2022 just over 50% of drugs were considered first-in-class.
Being first-in-class doesn’t seem to have much effect on the likelihood of a drug becoming a blockbuster, and within the cohort of blockbusters first-in-class drugs have similar revenues to follow-ons. There’s a nice article by VC Bruce Booth from 20069 that covers this topic, I’ll quote one of their conclusions here because I think it still stands true today:
“Although conventional wisdom in the pharmaceutical industry had often attributed disproportionate value to being first in class, we and others have recently found that being ‘best’, rather than first, has historically created more value. Much of the industry’s past value creation has come not from first-in-class drugs against completely new targets, but from follow-on drugs that improve the efficacy or reduce the side effects of existing compounds. Most of the industry’s blockbuster drugs have been developed as best-in-class clinical innovations, and only rarely were they ‘discovered’ as first-in-class agents.”
Booth’s analysis found that “fast-follower” drugs - those that came to market 2 to 5 years after the first-in-class drug - had the highest median value of sales. Even drugs that come to market later than 5 years on from the pioneer can be hugely successful if they are sufficiently differentiated: Lipitor was approved 9 years after the first statin (Mevacor) and still went on to be one of the highest revenue drugs of all time, generating >$150 billion in cumulative revenues. More recent analyses have also found weak first-to-market advantages that disappear when the lead time is short, or when the first-in-class drug is launched by a small company10.
It may soon be the case that lead times decrease to such an extent that being first-in-class will offer no tangible advantage at all. There’s good reason to believe that lead times are decreasing, with follow-on drugs coming faster and faster1112. Median lead times decreased from 10 years in the 1970’s to 1.2 years in the late 1990’s13, and they have only gotten shorter since then as our discovery and development capabilities have increased. Wherever there’s a promising target these days programs seem to pop up like mushrooms - good examples are the dozens of PD-1 monoclonal antibodies, CD19 CAR-T’s, or sickle cell disease gene therapies in various stages of development. It’s getting really crowded out there and harder than ever to stand out, especially in oncology. Even so, it’s hard to believe that bringing best-in-class assets to market will cease to be rewarded in the future, even if they are late entrants.
Blockbusters aren’t getting older, with some exceptions
Aging blockbusters that sell billions every year and never seem to go generic regularly make headlines. Humira’s a good example: 20 years on from its 2002 approval with ~$220bn in cumulative revenues, it’s finally starting to go generic. If all you read about are the newsmakers like Humira you might think that ancient mega-blockbusters are increasingly overstaying their welcome and holding healthcare systems hostage with unjustified price hikes. There is some truth to that, but in reality these are a minority of isolated cases.
Loss of exclusivity usually happens after ~13 years on the market, but it can take as long as 20 years (the full patent term) depending on development time and the intellectual property strategies employed. Genericization usually functions well as a mechanism to reduce prices and make room for new drugs in healthcare budgets - especially for small molecules - but for a variety of reasons, some branded drugs manage to delay generic entry for additional years or even decades.
If we look at the average age of blockbusters by year we don’t see much of a change in the average or median age of blockbusters since the year 2000. The median has remained at ~10 years on the market over the whole time period, and the average (shown by the dotted line in boxplot below) has been steady at ~13 years. It’s not surprising that blockbusters are typically older drugs, as revenue tends to grow steadily the longer drugs are on the market and the highest revenues are often achieved right before patent expiry.
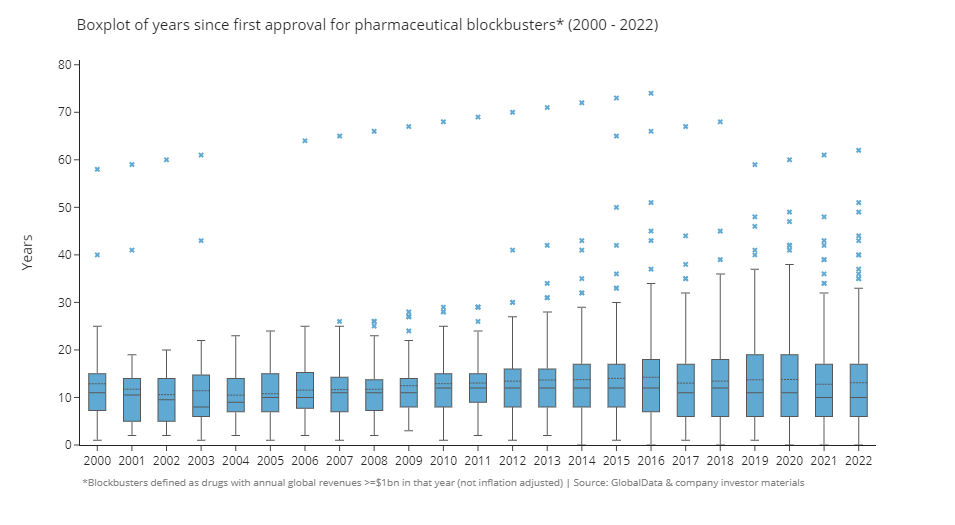
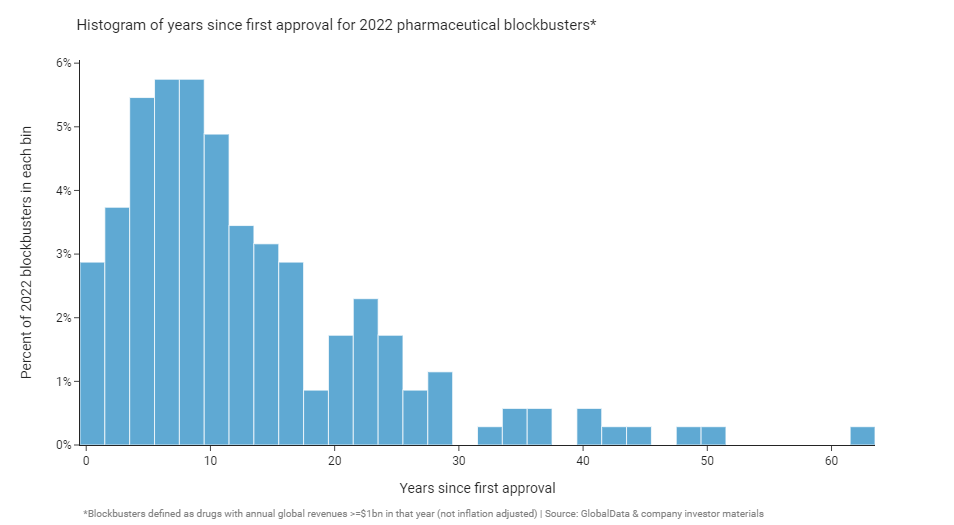
Still, there are quite a few old-age outliers. If we focus on 2022 blockbusters and look at the year these drugs were first approved (in any country) we see that most are clustered around the 4 to 11 year old mark, but some are very old indeed: 39 (22%) were first approved 20 or more years ago, and 7 (4%) were approved more than 40 years ago!
The list of blockbusters that have been on the market for over 20 years (greater than the length of a patent term) is an eclectic mix of old insulin formulations (e.g. Humulin, Humalog, Lantus), biologics that are hard to copy or have unusual manufacturing processes (e.g. Creon, Lovenox, Botox), aging monoclonal antibodies (e.g. Remicade, Humira, Herceptin, Rituxan), and strong brands with surprising sticking power. Lipitor is still generating around $1.6 billion dollars a year for Pfizer, almost all of that outside the US!
Biosimilars have been slow to get rolling (especially in the US), and we’ve only recently started to see genericization hitting the prices and revenues of big biologic brands like Humira, Avastin, and Herceptin in a meaningful way. Over the next few years the patents on further big biologic blockbusters are set to expire, and the industry is expected to face a massive patent cliff with over $200 billion in revenue at risk through 2030. The need to replace these expiring revenues with fresh blockbusters will be a dominant theme of the next 5-10 years or so.
The retreat of small molecules and the ascent of monoclonal antibodies
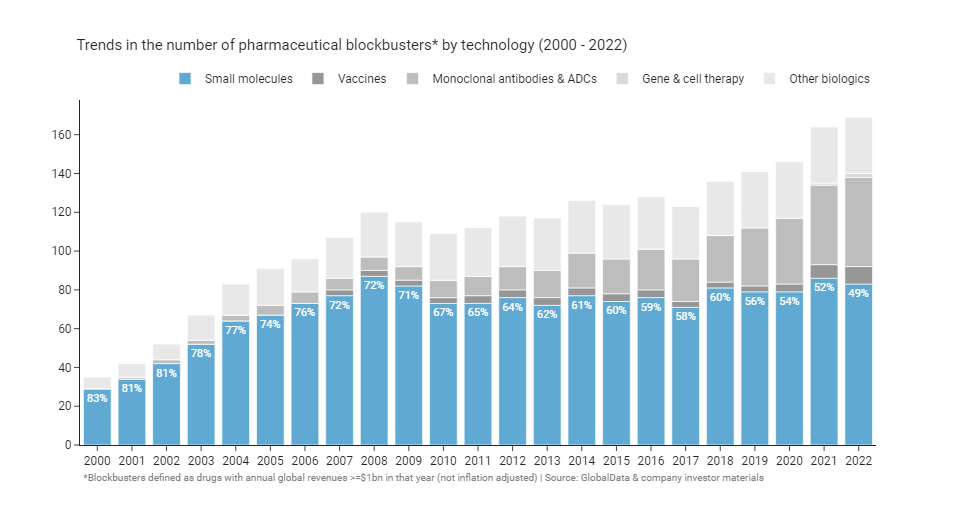
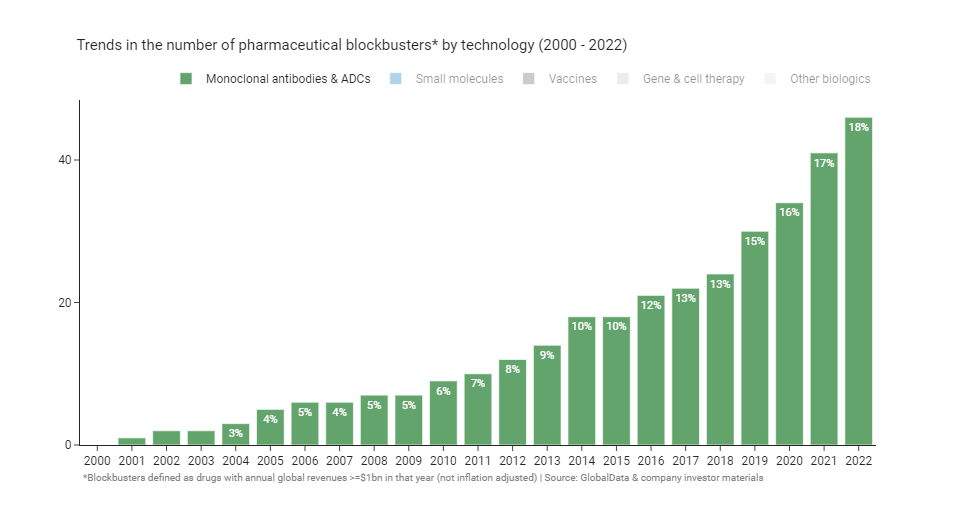
When the average person thinks of a drug, they probably imagine an oral small molecule pill like Lipitor, Prilosec, or Celebrex - the big mass market blockbusters of the early 2000s. Yet, a modern blockbuster is just as likely to be a complex biologic as a small molecule. At the turn of the millennium small molecules made up 80% of blockbusters. Twenty-two years on, there are now (just about) more biologic blockbusters than small molecules for the first time ever.
The expanding biotech toolbox has provided more opportunities to go after previously intractable targets with monoclonal antibodies, enzyme replacement therapies, oligonucleotides, or cell and gene therapies. On the other hand, small molecules have started to run out of attractive druggable targets. As Michael Gilman put it on twitter:
“Small molecules were beginning to exhaust their potential target pool, leading to fewer true breakthrough small molecule meds. With the recent expansion of the toolkit - degraders, etc. - that trend could reverse.”14
The shift to biologic blockbusters follows relative declines in the number of small molecules making it to market overall: The share of small molecule approvals has decreased in recent years15, and small molecules have a lower probability of successfully making it out of clinical development16. Once they’re on the market, biologics have another advantage over small molecules - they are harder to copy and therefore take longer to go generic than small molecules17. Once they do go generic, branded biologic revenues have proven to be sticky; originators aren’t directly substitutable by biosimilars, and financial incentives for use have often favoured incumbent brands. As we saw in the last section, some biologics can resist genericization and retain meaningful revenue for decades, something you rarely see with small molecules.
As a consequence of these trends, essentially all the growth in the number of blockbusters since 2008 has been driven by biologics, specifically monoclonal antibodies. You can see that clearly if you highlight and isolate them from the graph above.
For now it seems likely that biologics will continue to take an ever greater share of blockbusters in future. Cell and gene therapies are starting to generate blockbusters (e.g. Zolgensma, Yescarta), monoclonal antibodies show no sign of slowing down, and COVID has led to a surge of interest and investment in vaccine and oligonucleotide technology. Policy isn’t offering much help to small molecules either: the Inflation Reduction Act (IRA) notably favours biologics over small molecules by giving biologics four extra years before price negotiation kicks in for reasons that are unclear, and possibly unintentional.
Rare diseases and the rise of orphan blockbusters
Before the 1980’s few companies commercialized drugs for rare diseases, reasoning that their small patient populations would make development economically unviable. Today, rare disease focused biotechs are abundant and orphan drugs fill the pipelines of large pharmaceutical companies. A large fraction - the majority even - of new launches are orphan drugs: 20 out of the 37 (57%) drugs approved by the FDA in 202218. Far from being economically unviable, many significant recent blockbusters like Spinraza, Hemlibra, and Vyndaqel target rare genetic diseases. What changed?
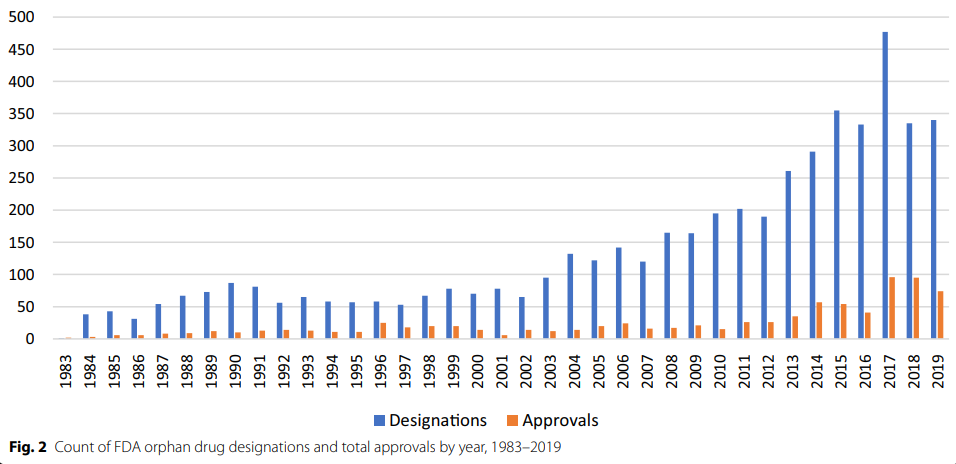
Policy is one oft cited reason for the increase. The US Orphan Drug Act was passed in 1983 to incentivize the development of drugs for small patient populations without adequate therapies. Japan enacted a similar law in 199319, and Europe followed in 200020. Orphan designations confer a number of benefits such as tax credits, extra support from regulators, regulatory fee exemptions, and most importantly, protection from generic entry (i.e. market exclusivity) after approval for 7 years in the US21 and 10-12 years in the EU22. Obtaining these designations is straightforward; drug developers need only show that their drug is plausibly able to treat a rare condition which affects fewer than 200,000 patients in the US, or fewer than 5 in 10,000 patients in the EU (each region has slightly different thresholds). Since the introduction of the status, orphan designations and approvals have increased markedly23.
Although orphan designations certainly helped, it’s hard to say whether their creation really caused the increase in rare disease drugs and blockbusters. Many rare disorders are genetic, and the rise of orphan drugs coincided with the advent of recombinant technology and biotech generally. Another plausible catalyst is the invention of the high-price rare disease business model, often attributed to Henri Termeer, the long serving CEO of Genzyme24.
Under Termeer in 1994, Genzyme launched the enzyme replacement therapy Cerezyme for Gaucher’s disease at a US price of ~$200,000 per year for an average patient25. This price was far in excess of the cost to manufacture the enzyme in recombinant cells, allowing Genzyme to reap substantial profit from a small number of patients (~4,500 in 200524). The clear unmet need in Gaucher’s coupled with the small prevalent population meant payors were willing to absorb the high price, since the relative impact on their overall budgets was low. Cerezyme’s revenue peaked at $1.2 billion dollars a year in 2006; a successful product by any metric - rare disease or not.
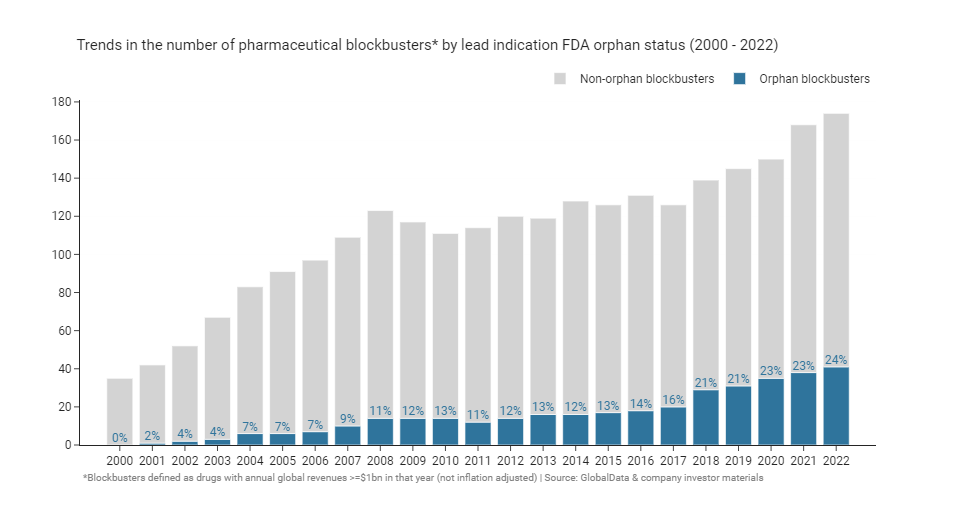
The validation of the high-price business model by Genzyme and other pioneering firms spurred other companies to spin up orphan drug development programs. Orphan drug prices, too, have been pushed to higher and higher heights: ~$400,000 per year for Alexion’s Soliris in 200726, ~$750,000 for the first year of Biogen’s Spinraza in 201727, and this year CSL Behring announced a price of ~$3.5 million for a one-time dose of their gene therapy Hemgenix28 (US list prices at launch). Orphan drugs now represent a larger than ever fraction of blockbusters, with every indication that this trend is set to continue as our capabilities with new modalities like gene and cell therapies and gene editing improve.
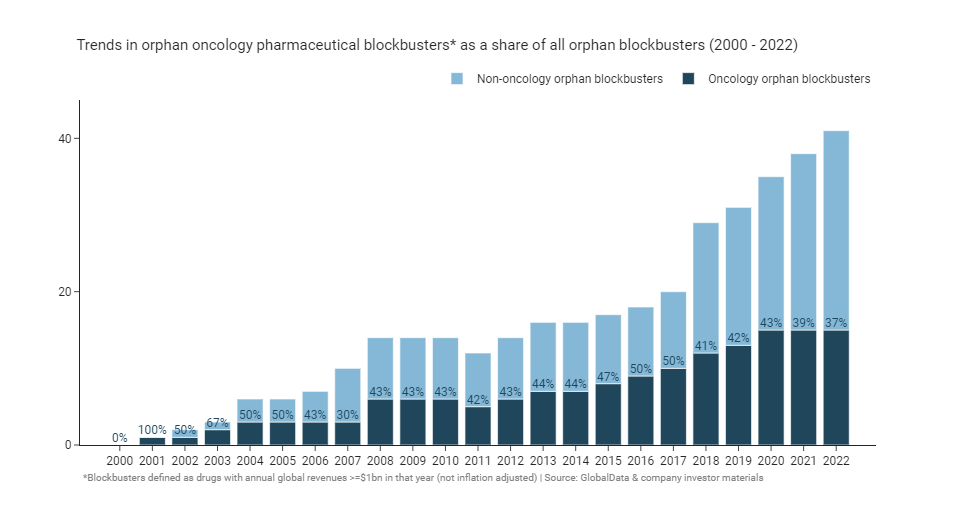
Rare diseases are often thought of as inherited genetic disorders, although oncology indications have made up a third to a half of orphan blockbusters since 2000. This doesn’t necessarily mean that an oncology orphan drug is more likely to become a blockbuster than a non-oncology drug on a 1:1 basis. It’s more likely a consequence of the dominance of oncology of the overall pharmaceutical development pipeline. 37% of FDA orphan designations between 1983 and 2019 were for oncology drugs, consistent with their share of blockbusters - although oncology’s share of overall designations has grown over time23. Since orphan designation can be given for a subpopulation of an overarching disease, the increase in oncology designations also reflects the common strategy of products entering first into later lines of therapy prior to expansion into larger earlier lines, as well as the general shift away from chemotherapy towards targeted therapies (e.g. inhibitors of EGFR, ALK, RET, etc.).
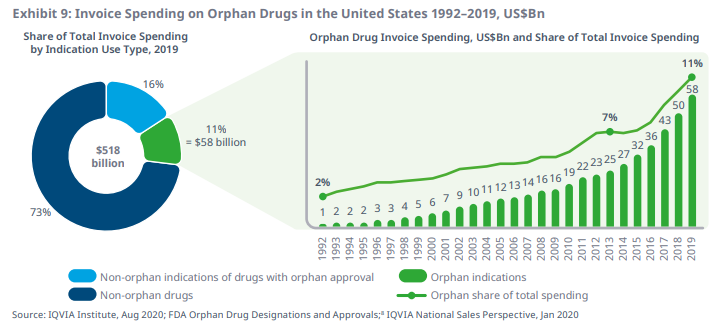
Even though we’re seeing more and more orphan blockbusters, there is reason to think that the orphan disease model may become a victim of its own success. As more drugs get developed for rare diseases, their aggregate budget impact and share of healthcare system drug expenditure is likely to continue to balloon. There are after all apparently more than 10,000 rare diseases29, most without an approved treatment (yet). The below graph from IQVIA30 shows the trend of increasing orphan spending clearly.
Another “good problem to have” is that many of the newer rare disease drugs - like Vertex’s cystic fibrosis franchise31 - are so effective that they are prolonging the lifespan of patients with previously deadly conditions, meaning payors need to cover high prices for far longer than they may have initially expected for a population that’s growing in prevalence. As a consequence of these increased budget pressures, it seems likely that we’ll soon see more overt payor pressure to reign in the high prices that the rare disease business model relies on.
The transition from primary to specialty care
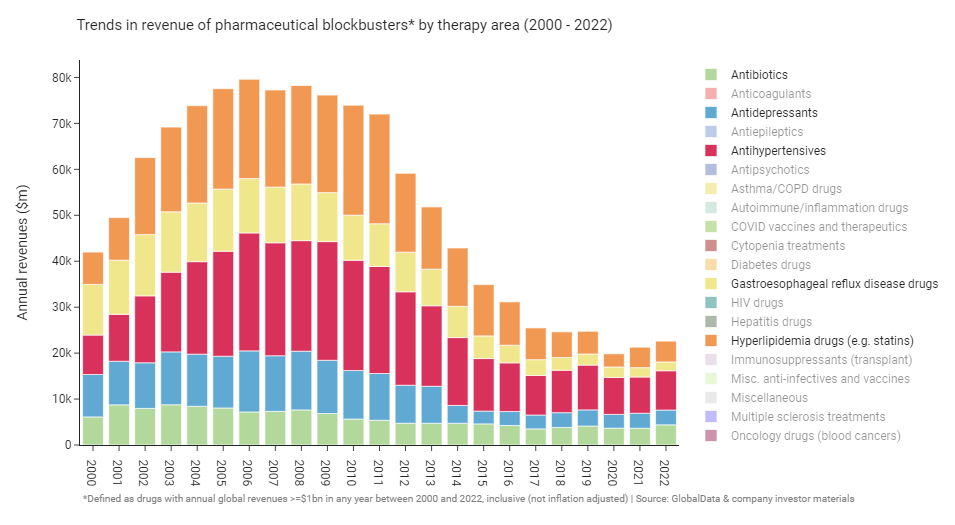
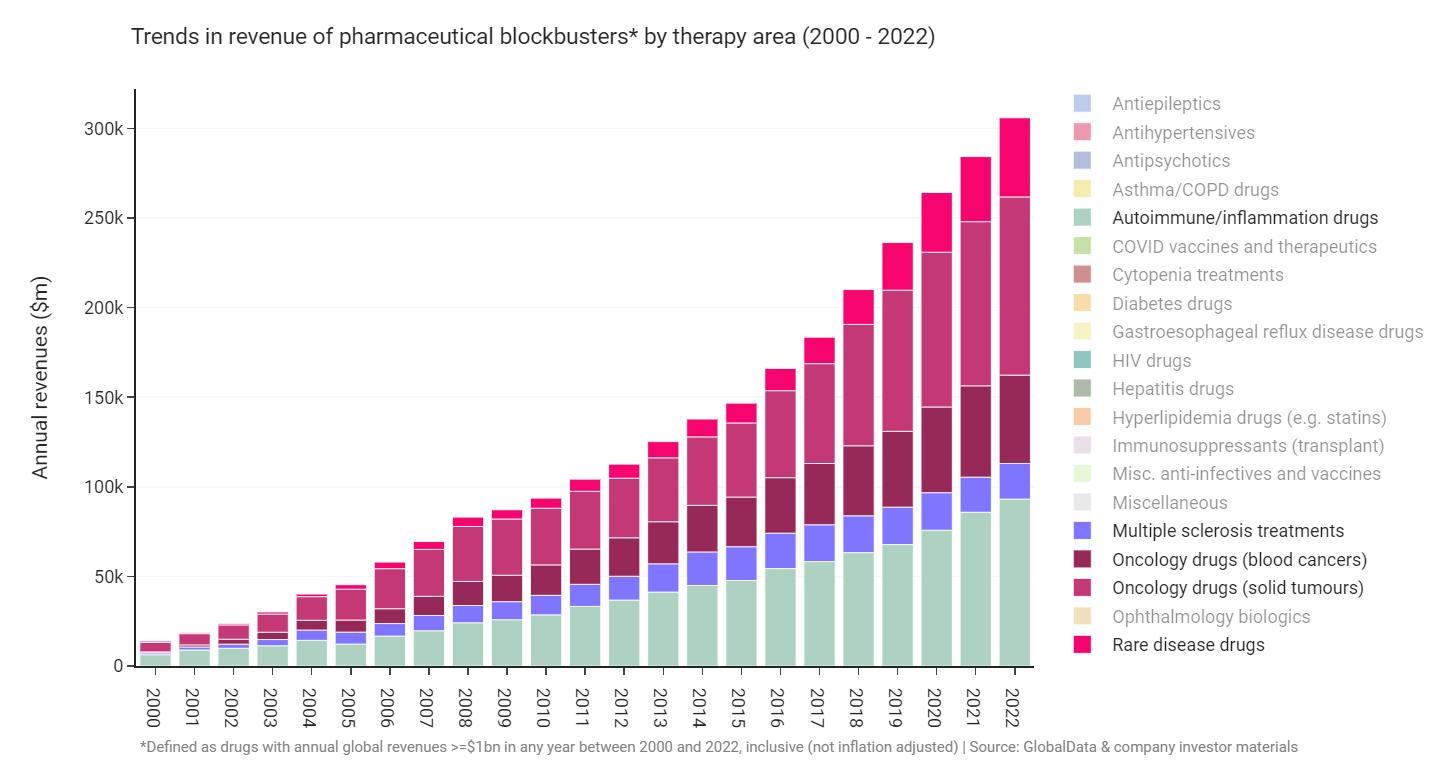
The industry’s shift towards orphan diseases is just one reflection of a more general transition towards high-priced specialty drugs that been ongoing since the early 2000’s. If we break down the revenues of blockbusters into key therapeutic area categories we can see the substantial changes in the overall composition of revenues that have taken place over that period.
Note: The graphs in this section show the revenues across all years for any drug with $1 billion in annual sales at any point between 2000 and 2022. This is why overall revenues are a bit higher than the revenue graph at the beginning which only counted revenue for a given year if it was above $1 billion in that year. The graph immediately below is interactive (you can click the legend to show or hide specific traces) - it might not display properly on small devices, or you may have to rotate your screen to see it (sorry!)
The above graph is a lot to take in, so to help visualize the trends I’ve isolated the revenue trace lines below and marked when each of the categories peaked.
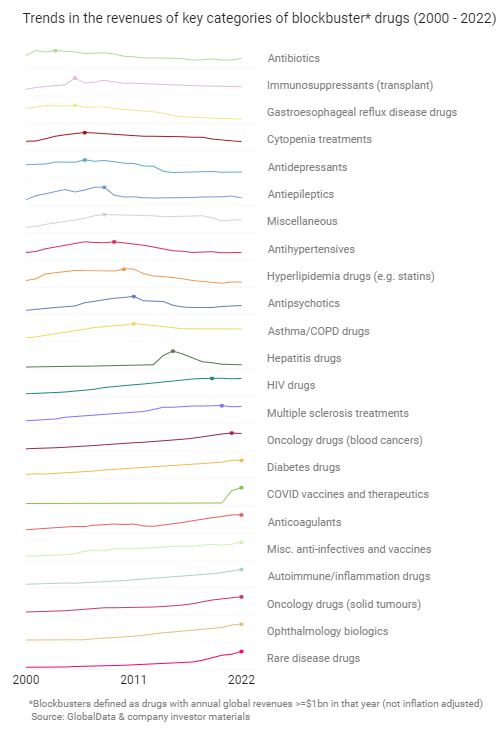
The pharmaceutical industry is cyclical, and if you look carefully at the latter graph you can see the two major cycles that have taken place since 2000. Cycle #1 was the primary care blockbuster era peaking around 2006-2011. That cycle was exemplified by relatively low-price medicines for high-prevalence disorders like Lipitor, Prilosec, and Effexor. Cycle #2 is the specialty disease blockbuster era we’re in now led by drugs like Keytruda, Humira, Avastin, and Revlimid. While the indications targeted by Cycle #2 blockbusters typically have smaller patient populations and more specialist prescriber bases than the ones from Cycle #1, the loss in volume has been mitigated by higher prices. Another notable feature of Cycle #2 blockbusters, especially those in oncology and autoimmune disease, is that they are likely to be approved in multiple indications32.
To make the cycles more concrete I’ll show a few illustrative examples. For Cycle #1 we can isolate a selection of 5 indications that could reasonably be treated in a primary care setting by a general practitioner or family doctor, this could be used to tell a story of an industry in decline.
Now if we turn to Cycle #2 and isolate 5 more indications that are primarily treated by specialists, we instead see a robustly growing industry at record highs.
An archetypical “indication macrocycle” seems to have played out many times across therapy areas where blockbuster revenues grow steadily, reach a peak after around 20 years, and then decline as key blockbusters go generic. This process of boom and bust can tale place much faster when a curative drug comes along, Gilead’s hepatitis drugs being a good example. We may be seeing the pattern of peak, stagnation, and decline playing out in the specialty indications now. The blockbusters of Cycle #2 are getting old: revenues of HIV and multiple sclerosis blockbusters look to have peaked already, and the peak of oncology and autoimmune blockbusters may not be far off.
The coming COVID cliff
Before closing I have to touch on COVID which was, clearly, the dominant macro event of the early 2020’s. The biopharma industry responded admirably, rapidly ushering hundreds of vaccine candidates into development, and many therapeutics besides. The development, manufacturing scale up, and approval of multiple COVID vaccines within a year is arguably the industry’s biggest accomplishment to date.
COVID, it is true, was also a substantial financial windfall for the pharmaceutical industry. Pfizer in particular was a key beneficiary. Of the 13 COVID blockbusters in 2022, Pfizer developed the two with the highest revenues: Comirnaty and Paxlovid. Pfizer’s COVID blockbusters together accounted for ~$56 billion of the ~$100 billion in revenue that all the COVID blockbusters made in 2022.
COVID revenues are set to fall of dramatically in 2023 as we exit the pandemic and demand for vaccines and therapeutics wanes. Reuters has a good article on the coming “COVID cliff” that will see companies lose the majority of their COVID revenue streams over the next few years. As a result, it’s likely that 2022 blockbuster revenues will remain a record, at least for a few more years.
Blockbusters: the next cycle?
The pharmaceutical industry has seen plenty of change over the past two decades: the rise and fall of the primary care blockbuster, and the transition to specialty diseases key among them. What changes might we expect to see over the next 20 years? I think past and emergent trends can give us some insight here, and if you’ll permit me to speculate, here are some of my predictions for what the next cycle (playing out over ten to twenty years or so) may hold:
Prediction #1: The fundamental economics of the industry stay much the same
- Drug revenues continue to be unevenly distributed such that a small minority of drugs continue to drive a majority of overall industry returns. Companies still rely on blockbusters to maintain an attractive potential return on investment
- Industry-wide productivity (measured in terms of return on investment in research and development) stays much the same as today. We get much better at discovering and designing drugs, but those improvements are offset by increased competition and the ever-worsening “better than the Beatles” problem
- The long tail of small revenue drugs gets longer. The average number of launches per year is higher in the 2020’s and 2030’s than any prior decade, but the revenue of the median drug is lower
Prediction #2: It gets harder than ever to defend blockbuster revenues
- Fast followers get faster than ever; median lead times for first-in-class drugs decreases to less than 6 months
- The durability of blockbuster revenues decline. Validated targets become crowded with follow-on drugs and competition for patients is fierce. New price-control policies (most notably the Inflation Reduction Act) constrain the prices and revenues of top-selling drugs
- Durability and defensibility of revenues becomes a key industry buzzword; instead of putting emphasis on being first-to-market, companies will focus on being best-to-market and hard to copy
- Biologic revenues fall off much faster following biosimilar entry than they do today, and act more like small molecules. The kinks in the biosimilar market get worked out; incentives and loopholes that favour incumbent brands are mostly closed. Patient and physician acceptance of biosimilars improves to near parity with small molecule generics. Biosimilar manufacturing costs come down, leading to greater price discounting
Prediction #3: Out of favour indications make a comeback
- Biopharma is increasingly criticised by those outside the industry for shifting focus to small-prevalence, high-price specialty opportunities and neglecting larger public health concerns like cardiovascular disease, antimicrobial resistance, mental health, and neurological disease
- The revenues of cycle #2 blockbusters peak by 2030
- Oncology falls out of favour as key blockbusters go generic, policy and payor pressures reduce prices, and competition becomes too intense. Revenues of most new targeted oncology drugs disappoint and most big pharma companies curtail their investments
- Autoimmune blockbuster revenues decline as it proves hard to meaningfully improve on older biologics for rheumatoid arthritis and most other large autoimmune indications. Pockets of opportunity remain in underserved conditions like lupus or rare autoimmune disorders
- Orphan blockbusters decline (see prediction #4 for more details)
- The biotech toolkit (incl. gene therapy) expands into more common acquired diseases as our understanding of complex biology improves and manufacturing costs decline. This leads to a revisiting of highly-genericized out of favour indications with remaining unmet needs (e.g. cardiovascular)
- Cycle #3 begins and peaks around 2035 led by blockbusters for targeted cardiometabolic disease, neurology (especially neurodegeneration), and psychiatry
- New push and pull incentives lead to a resurgence in the development of antibiotics and medical countermeasures for future pandemics and bioterrorism
Prediction #4: Orphan drug prices come under pressure, orphan blockbusters fall off
- Orphan drug prices come under increasing political and payor pressure as rare disease drugs take up a higher portion of healthcare budgets in aggregate through the mid to late 2020’s. Inflation-adjusted launch prices for orphan drugs are lower in the 2030’s vs. the 2020’s
- Single-target orphan gene therapies never become an important class of blockbusters in revenue terms, even though many patients benefit along the way. The well of rare diseases with sufficient prevalence, high unmet need, and tractable biology turns out to be shallow
- Pricing pressures and the push into ever smaller indications leads to a renewed focus on cost-efficient development programs, especially in rare orphan diseases
- Regulators (led by the FDA) become much more accommodating for orphan programs in ultra-rare diseases with solid mechanistic rationale and increasingly allow approvals based on surrogates and single arm trials. We see the first application of the “animal rule” (or something like it) for an ultra-orphan disease
- Underserved rare disease communities self-organise and get more involved in developing their own drugs. We see a vibrant ecosystem of n-of-1 trials and repurposing attempts emerge
- Screening and preimplantation genetic testing becomes commonplace for at-risk families, decreasing the incidence of many rare diseases
Prediction #5: Blockbuster drugs get more diverse and personalized, platforms become blockbuster products
- Blockbusters become increasingly diverse in terms of modality. It becomes strategically vital for pharmaceutical companies to have access to a wide variety of platforms in order to ensure they have a good chance of developing the best-in-class drug for a given target
- Small molecules as a share of blockbusters continue to decline, although we do see innovation and some representation from new classes like degraders
- Artificial intelligence has its most concrete impact in the generative design of new complex biologics and small molecules against validated targets, as well as in the design of “shotgun” combinations that modulate multiple pathways and targets simultaneously
- The need to differentiate and stave off copycats means blockbusters become increasingly complex mixtures of molecules, devices, and processes. We see a surge in investment in beyond-the-pill approaches with meaningful clinical value such as novel delivery mechanisms or tuneable drugs with software-enabled dynamic dosing regimens. In some hard-to-manufacture cases like autologous cell therapies, the process effectively becomes the product
- Personalized medicine scales up as platforms become products. Cell therapy and cancer vaccines come of age and are applied in earlier lines of therapy. We see the emergence of broad platform approvals for gene therapy/editing in rare diseases with similar pathophysiology but different underlying causal mutations (e.g. retinitis pigmentosa)
Looking forward to revisiting these predictions in 20 years!
Addendum: I got some good feedback after publishing that I didn’t sufficiently address the potential for the Inflation Reduction Act (IRA) to disincentivise investment in diseases of aging or with a high Medicare/Medicaid population. I shared the criticism and some more information about the IRA on Twitter here. I also added the following note on the IRA to the second bullet of prediction #2 “New price-control policies (most notably the Inflation Reduction Act) constrain the prices and revenues of top-selling drugs”. I didn’t talk much about the IRA because I think the impact it will have on early-stage indication prioritization is overblown, but it should absolutely have a big impact on long-term blockbuster revenue potential (something it’s fair to say I glossed over). However, the potential magnitude of the changes in the IRA are big enough that I could easily be wrong here.
-
The importance of blockbusters for the pharmaceutical business model has long been recognized by the industry. Companies court investors by highlighting pipeline assets with “blockbuster potential”, and much effort is expended in the hunt for new high-value assets to keep the pipeline well-stocked. Putting aside whether blockbuster potential can be accurately forecasted in advance (a task with a poor historical track record), it’s vital for companies operating in an industry driven by tail events to try and maximize their exposure to upside risk. Betting on low-probability, high-value projects (“lottery tickets”) can be justified when the alternatives are safe projects that don’t pay for themselves ↩
-
I did not adjust any numbers for inflation in this post, and all claims are made on that basis. I decided not to adjust because it’s somewhat arbitrary which index to use for the adjustment of global revenues (worldwide or US? Drug price index or CPI?). It feels cleaner just to use the raw data to me. After all, the blockbuster threshold has remained consistent at $1 billion in annual revenue over the years ↩
-
As of the time I pulled the data in early 2023 from GlobalData. I also did some cross-checking against company investor materials to fill gaps in the data, but didn’t spend an extensive amount of time doing this. The true number may be a bit lower or higher, depending on gaps in GlobalData or gaps in company reporting. I don’t personally guarantee all the data in this post is 100% accurate, although I’ve done what I could in the time I had available and I’m confident all the trends discussed in this post are directionally accurate ↩
-
Throughout this post I count a drug as a blockbuster only if it has global annual revenues of $1 billion or more in a given year. A drug can be counted as a blockbuster in one year, and not in another. A drug becomes a blockbuster when its revenue exceeds $1 billion for the first time in a single year. A drug stops being counted as a blockbuster when its revenue falls below $1 billion in a single year ↩
-
https://www.iqvia.com/insights/the-iqvia-institute/reports/the-global-use-of-medicines-2023 ↩
-
https://www.healthaffairs.org/doi/10.1377/hlthaff.2012.0541 ↩
-
https://www.fda.gov/drugs/development-approval-process-drugs/new-drugs-fda-cders-new-molecular-entities-and-new-therapeutic-biological-products ↩ ↩2 ↩3
-
https://www.mckinsey.com/industries/life-sciences/our-insights/pharmas-first-to-market-advantage ↩
-
https://www.evaluate.com/vantage/articles/data-insights/other-data/pharmas-fastest-followers-revealed ↩
-
https://www.bcg.com/publications/2022/a-rising-tide-and-choppy-waters-ahead-for-pharmaceutical-companies ↩
-
https://twitter.com/michael_gilman/status/1623327868099997701 ↩
-
https://www.bio.org/clinical-development-success-rates-and-contributing-factors-2011-2020 ↩
-
https://www.ema.europa.eu/en/human-regulatory/overview/orphan-designation/legal-framework-orphan-designation ↩
-
https://www.fda.gov/industry/medical-products-rare-diseases-and-conditions/designating-orphan-product-drugs-and-biological-products ↩
-
https://www.ema.europa.eu/en/human-regulatory/research-development/orphan-designation/orphan-incentives ↩
-
https://ojrd.biomedcentral.com/articles/10.1186/s13023-021-01901-6 ↩ ↩2
-
https://icer.org/news-insights/press-releases/sma_evidence_report ↩
-
https://news.bloomberglaw.com/health-law-and-business/worlds-most-expensive-drug-revives-push-for-new-payment-models ↩
-
https://www.iqvia.com/insights/the-iqvia-institute/reports/orphan-drugs-in-the-united-states-rare-disease-innovation-and-cost-trends-through-2019 ↩
-
https://www.nytimes.com/2023/02/06/opinion/cystic-fibrosis-treatment.html ↩